My first kaggle competition: March Machine Learning 2025
Published:
Problem
I’ve always wanted to compete in Kaggle. And the cool thing about being a consultant is that on case break, I actually have some time to commit to Kaggling!
For my first competition, I chose the March Machine Learning Mania 2025. The goal here was to forecast the outcomes of the NCAA basketball results. Now I have more reasons to watch basketball!
Approach
I based my approach off the 2023 winner (who in turn based of the 2018 winner). Thank you @rustyb and @raddar!
Data Preparation.
- I used regular season results, box scores, and tournament seeding as my features. So to predict who wins for team A vs team B, I get the features of both teams.
- One key thing I learnt from the winner’s solution is to also include features of how team A opponent’s fared against team A in the regular season. Intuitively this accounts for Team A’s defence: if team A’s defence is good, the average box scores of the opponent will likely be lower.
Feature Engineering.
- I did basic feature engineering: difference in seed ranking, difference in points, offence efficiency.
- I tried alot many fancy stuff (e.g. adjusted efficiencies) but they didn’t improve my validation scores sadly.
Modelling.
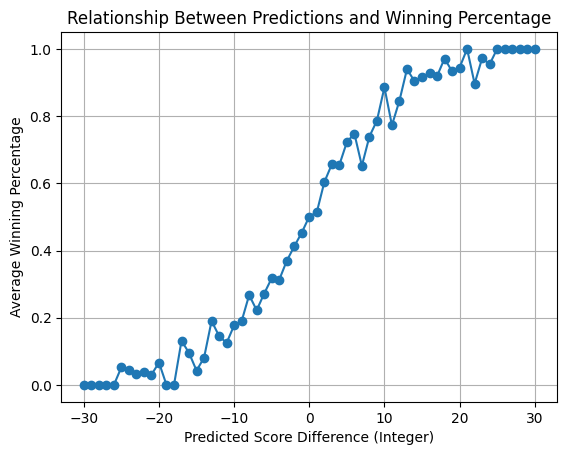
- Even though this is a binary classification problem, the winner chose to model the point difference and map the point difference to probabilities using splines. I have no idea why so I asked ChatGPT: the evaluation metric is brier score (or MS in this case) which rewards well caliberated predictions. Since MSE penalizes large deviations, a well-calibrated continuous prediction (like point spread) leads to better performance than a binary choice.

- The winner also trained 10 iterations, with each iteration doing CV of 5 folds. As the dataset is very small, this helps reduce randomness.
Evaluation.
- To test each experiment, I evaluated on 2022-2024 seasons (and trained on all seasons preceding the evaluated season). An experiment is accepted if the mean score improves on the current best mean score.
Feature Importance.
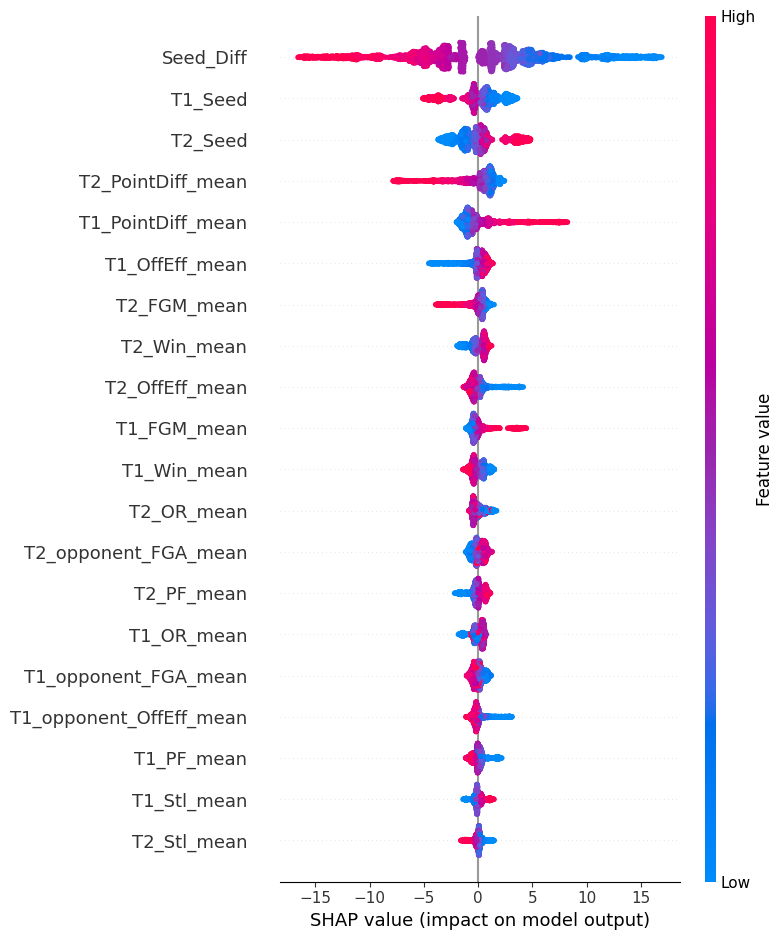
- Here’s the SHAP values plot. Expectedly seeding and how much a team wins by made the biggest difference. Interestingly offence efficiency, field goals made, and win ratio came up too. Unfortunately my attempts to improve these features (e.g. changing offence efficiency to adjusted offence efficiency) did not yield improvements.

What I should have done better
- Data. I should have curated more relevant data (e.g. injury reports, player stats, betting odds, pick predictions, elo system). Curating quality data when they’re not easily available is the part I want to get better at. Not so easy as they are usually behind paywall though.
- Analysis. I didn’t do much analysis as I struggle with the so-what of analysis: so what if I plotted the distributions of box scores over season? How can this improve the modelling? Still, I feel that EDA is super important and I look forward to improving my results as I become a better analyst.
- Studying public notebooks in current submission year. I realized the public forks of current submission year are doing pretty well! They tend to be improvements on past year’s winning solutions (which I studied). Problem is that they are released quite late to the deadline. Maybe I should have started even later?
- Multiple submissions which are quite different from each other. I submitted two submissions which are very similar. On hindsight, I should have submitted two completely different approaches.
Conclusion
All in all, I had so MUCH FUN participating. Huge thanks to Kaggle for putting together this competition. I look forward to my next case break when I can compete again!!
